Applications
Explore auxiliary applications, dashboards, and visualizations that draw from the Natural Flows Database
Water is essential for California’s people, economy, and environment. Centuries of water management through dams and diversion have altered the flows in many streams and rivers, which can harm the freshwater ecosystems. The Nature Conservancy and the United States Geological Survey (USGS), and other partners have generated estimates of natural flows (expected streamflow in the absence of human modification) in all the streams and rivers in California from 1950 to the present.
California Environmental Flows Working Group (CEFWG). California Natural Flows Database: Functional flow metrics v1.2.1, May 2021. https://rivers.codefornature.org. (Date Accessed)
Julie K.H. Zimmerman, Daren M. Carlisle, Jason T. May, Kirk R. Klausmeyer, Theodore E. Grantham, Larry R. Brown, Jeanette K. Howard. California Unimpaired Flows Database v2.1.2, 2023. The Nature Conservancy. San Francisco CA. https://rivers.codefornature.org. (Date Accessed)
The Nature Conservancy and Upstream Tech. Predicted Daily Flow Data, Version 1.0.0, 2026. San Francisco, CA. https://rivers.codefornature.org. (Date Accessed)
The Nature Conservancy. Functional Flow Metrics from Predicted Daily Existing Flows, Version 1.0.0, 2026. San Francisco, CA. https://rivers.codefornature.org. (Date Accessed)
© Copyright The Nature Conservancy. Terms of Use | Privacy Policy
After more than a century of dams and diversions, many of California’s streams and rivers have highly altered flow. We used machine learning to estimate natural flows (expected streamflow in the absence of human modification) for all streams and rivers in California to help water managers identify and manage flows to support native freshwater species.
California has higher variability in hydrology between wet and dry years than any state in the US, due to a small number of winter storms providing most of the state’s precipitation (Dettinger, 2011). California also has strong spatial gradients in water availability, with 90% of the state’s water originating from 40% of its land surface (Hanack et al., 2011). Managing this variability has led to some of the most extensive water infrastructure in the world. Although more constant streamflows are desirable to support human uses, such alterations to natural variability across seasons and landscapes can have negative consequences for native species and communities.
Understanding natural flows and patterns of alteration is an important first step in managing California’s rivers and streams for human and ecosystem benefits. To protect freshwater biodiversity, we need to know California’s hydrologic foundation, including the flows that would have been in our streams and rivers in the absence of water use and human land use. We have predicted natural flows statewide and expressed these predictions as monthly flow and functional flow metrics. The methods and statewide results of the monthly flow predictions are published in Freshwater Biology (Zimmerman et al., 2017). Functional flows are aspects of the annual flow variation that directly relate to ecological, geomorphic or biogeochemical processes in riverine systems (e.g., wet-season peak flow, dry-season base flow). The functional flow metric predictions are part of the California Environmental Flows Framework (CEFF), a statewide approach to develop stream segment-scale ecological flow criteria that protect native aquatic species and communities. This approach requires that the natural range of variation of functional flow metrics (FFMs) be estimated at any potential location of interest in California.
We partnered with the U.S. Geological Survey (USGS) to develop a modeling approach that uses machine learning to predict monthly flows statewide. We identified 250 reference stream gages with little or no flow alteration across the state and split them into three regions based on climate and hydrologic conditions: Interior Mountains (including the Sierra Nevada and Klamath mountains), North Coastal Mountains (including the mountains in the north western portion of the state), and Xeric (including the Central Valley, Central and South Coast, and desert portions of the state). Using the observed monthly flows at the reference gages, we developed statistical models for each region that accurately predicted streamflow at these reference gages using fixed physical watershed characteristics (such as geology, soils, and elevation) and monthly climate data (such as precipitation, air temperature, and runoff volume). The models for each region were then used to predict flows at all streams in that region, using the NHDPlus Version 2 (Horizon Systems, 2018) to delineate stream reaches based on a common identifier (COMID). For each stream reach, we report the expected monthly mean, median, maximum, and minimum natural flow values for all months from 1950 to 2015. For each of these metrics, we also provide the average flow value predicted by the model (“estimated”) and the range of uncertainty, expressed as the 10th and 90th percentile of predicted values (“P10” and “P90”). For a full description of the datasets and methods used to generate the natural flow data, see Zimmerman et al, 2017.
Predicted monthly flows for 2016 to the present were generated using the same methods outlined above with the following modifications:
To assess the predictive accuracy of the model, we compared the predicted monthly mean flows to observed flows at 81 reference stream gages with flow data between 2010 and 2021. These reference gages are on streams expected to have natural flows because there are no major land use or hydrological modifications upstream from the gage. We found the models accurately predicted monthly flows, with an average Nash-Sutcliffe model efficiency (NSE) coefficient of 0.96 for the 2010-2015 time period and 0.92 for the 2016-2021 time period (a NSE of 1 indicates a perfect model). To compare the performance of version 2.1 models with the previous version, we evaluated the original model predictions against observations at the same set of reference gages from 2010-2015. The average NSE for the predicted versus observed monthly flow values for the original model during this period was 0.98, indicating a slight loss in model predictive accuracy with version 2.1. Using this method we will update the monthly flow estimates every 1-2 months as new climate data from PRISM become available.
Using a similar modeling approach, functional flow metrics were predicted for every stream segment in the state (Grantham et al., 2022). One key difference between the approaches is that monthly flows were predicted for each month over the time period of 1950-2015, whereas the functional flow metric models generate long-term predictions (across the entire time period of 1950-2015) of functional flows metric values for each stream segment. The expected natural range of functional flows are reported for all years, and for subsets of years classified as “wet”, “moderate” and “dry” water years. For this exercise, a set of 219 reference gages was used to train the models. We modeled metrics associated with five functional flow components including the fall pulse flow, wet-season baseflow, peak flow, spring recession flow, and dry-season base flow (Yarnell et al., 2020). Functional flow metrics that describe each of these functional flow components are described in the tables below. For each FFM, predictions are provided as a range (10th, 50th, and 90th percentile values), which reflects both model uncertainty and interannual variation. In Section A of CEFF, these predicted metrics are used to identify ecological flow criteria to protect native aquatic species and communities. For a full description of the datasets and methods used to predict functional flow metrics, see Appendix D of the CEFF Guidance Document and Grantham et al., 2022.
| Flow Characteristic | Flow Metric Name | Flow Metric Code | Flow Metric Description |
|---|---|---|---|
| Magnitude (cfs) | Fall pulse magnitude | fa_mag |
Peak magnitude of fall pulse event (maximum daily peak flow during event) |
| Start (water year day) | Fall pulse start | fa_tim |
Water year day of fall pulse event peak |
| Duration (days) | Fall pulse duration | fa_dur |
Duration of fall pulse event |
| Flow Characteristic | Flow Metric Name | Flow Metric Code | Flow Metric Description |
|---|---|---|---|
| Magnitude (cfs) | Wet season baseflow and median flow | wet_bfl_mag_10, wet_bfl_mag_50 |
Magnitude of wet-season baseflow and median flow (10th percentile and median of daily flows within that season, including peak flow events) |
| Start (water year day) | Wet-season start | wet_tim |
Start date of wet-season in water year days |
| Duration (days) | Wet-season duration | wet_bfl_dur |
Wet-season baseflow duration (# of days from start of wet-season to start of spring season) |
| Flow Characteristic | Flow Metric Name | Flow Metric Code | Flow Metric Description |
|---|---|---|---|
| Magnitude (cfs) | Peak flow magnitude |
peak_2,
peak_5,
peak_10
|
Peak-flow magnitude (2-year, 5-year, and 10-year recurrence interval) |
| Duration (days) | Peak flow duration |
peak_dur_2,
peak_dur_5,
peak_dur_10
|
Seasonal duration of 2-year, 5-year, and 10-year recurrence interval peak flow (cumulative number of days in which this peak flow magnitude is exceeded) |
| Frequency | Peak flow frequency |
peak_fre_2,
peak_fre_5,
peak_fre_10
|
When a peak flow event happens in a year, the number of times a peak flow amount is exceeded within one season (e.g., fall, wet-season) |
| Flow Characteristic | Flow Metric Name | Flow Metric Code | Flow Metric Description |
|---|---|---|---|
| Magnitude (cfs) | Spring recession magnitude | sp_mag |
Spring recession magnitude (daily flow on start date of spring-flow period, 4 days after last wet-season peak) |
| Start (water year day) | Spring start | sp_tim |
Start date of spring in water year days |
| Duration (days) | Spring duration | sp_dur |
Spring flow recession duration (# of days from start of spring to start of dry-season baseflow period) |
| Rate of change (%) | Spring rate of change | sp_roc |
Spring flow recession rate (median daily rate of change over decreasing periods during the recession) |
| Flow Characteristic | Flow Metric Name | Flow Metric Code | Flow Metric Description |
|---|---|---|---|
| Magnitude (cfs) | Dry season baseflow and high baseflow | ds_mag_50, ds_mag_90 |
Base flow magnitude (50th and 90th percentile of daily flow within dry season) |
| Start (date) | Dry-season start | ds_tim |
Dry-season baseflow start timing (water year day of dry season) |
| Duration (days) | Dry-season duration | ds_dur_ws |
Dry-season baseflow duration (# of days from start of dry season to start of wet season) |
We partnered with Upstream Tech to model daily unimpaired and existing (also referred to as “impaired” or “actual”) flows for all stream segments in California. We modeled daily streamflow over a 21-year period (water years 2002-2022) using a machine learning hydrologic modeling methodology. Two Long Short-Term Memory (LSTM) models were developed, one that is suitable for natural/unaltered basins (Unimpaired) and the second that makes predictions in streams with human induced alteration (Existing). This work was aligned to the NHDPlusV2 flowline dataset and is available for most stream reaches in California (identifiable by the unique comid).
LSTM is a type of neural network for time series data and learning relationships between inputs. The Unimpaired and Existing models shared the same architecture but differed in their inputs and how they handled upstream observations. Model development occurred in three steps: 1. base model development; 2. routing model development; and 3. downscale to reach predictions. Model inputs included weather data from the ERA5-Land reanalysis product, surface observations (e.g., MODIS, snow cover (NDSI) and vegetation vigor (NDSI), historic streamflow observations from USGS gages, and basin characteristics (e.g., topography, soil, land cover)). Full details about the methods to predict daily flows are available in Read et al., 2025 (note that Existing flows are called “actual” in this report).
Using the modeled daily flow data, we worked with Foundry Spatial to calculate the functional flow metrics for the mean prediction (“discharge_mean”) of the modeled Unimpaired and Existing flow data using the python version of the Functional Flow Calculator in July 2025. We included functional flow estimates for all, wet, dry, and moderate year types, similar to the predicted FFMs described above. We omitted results if the Functional Flow Calculator was unable to estimate a given metric for less than 5 water years. To evaluate hydrologic alteration, we compared the calculated FFMs from the modeled Existing flows data to the predicted unimpaired FFMs from the Functional Flow Calculator described above.
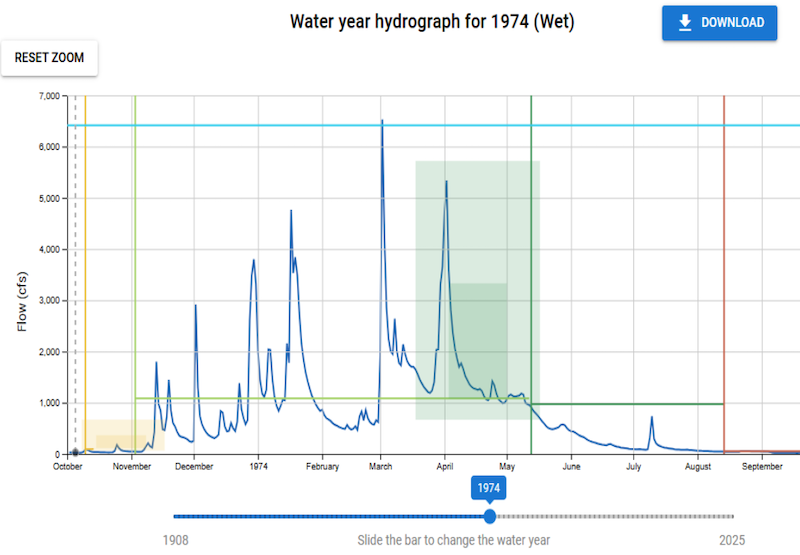
The mapping tool and API provide direct access to the results of this analysis. Within the mapping tool, users can click on any stream segment to see a summary chart of the average estimated natural flows for the full modeling period (1950 to the present). The charts show the average monthly flow for “Wet years” (predicted mean annual flows in the top third of all water years), “Dry years” (predicted mean annual flows in the bottom third of all water years) and “Mod. Years” (predicted mean annual flows in the middle third of all water years). When the user hovers over a line on the chart, the average of the P10 and P90 values are displayed to show the range of estimates (prediction interval) for any given stream. By clicking “Raster Hydrograph”, the user can see a raster hydrograph of all the predicted monthly natural flows by year and month.
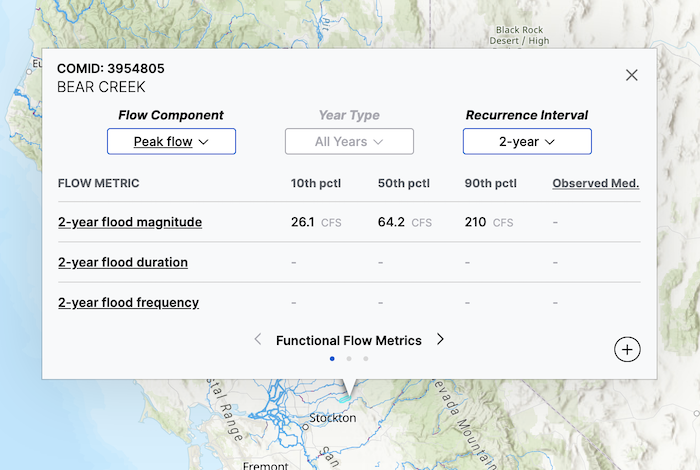
A user can see the predicted functional flows by selecting the “Functional Flow Metric” page at the bottom of the pop-up window for any stream segment. For each flow metric, a numeric value of flow, duration, or timing is provided for the mean model estimate (“50th Percentile”) as well as the range of model estimates expressed by the 10th and 90th percentile model results. Users can select different year types (“Wet”, “Dry”, “Moderate”, or “All Years”), as well as different functional flow components (see Table 1). Some functional flow components (e.g., Peak flow) provide different metrics depending on the recurrence interval of interest. For these components, the user can select and compare metrics between different recurrence intervals.
A subset of the streams in California have stream gages that measure observed flows. These segments are shown in purple in the mapping tool. For these streams, the summary chart shows a fourth line that indicates the average monthly observed flow at the stream gage. Please note that these averages are based on the data available and in most cases will not reflect the same 1950-2015 time period shown for the estimated data. In addition, a chart of flow alteration is available by using the control on the bottom of the pop-up to select the monthly flow alteration chart. This chart shows the percent of the observed monthly flows that are altered by being either inflated (blue bars) or deflated (red bars). An observed monthly flow is considered inflated if it is greater than the 90th percentile (P90) model estimate for that month and year. Similarly, an observed monthly flow is considered deflated if is less than the 10th percentile (P10) model estimate. For example, suppose the modeled flow in January 2015 for a given stream had a P10 estimate of 10 cubic feet per second (CFS) and a P90 estimate of 100 CFS. If the observed monthly average flow in January 2015 was 5 CFS, it would be considered deflated. If the observed monthly average flow in January 2015 was 110 CFS, it would be considered inflated. The chart summarizes the frequency of inflation or deflation for each month to show the type and seasonality of alteration. If all the observed flows for a given month are not altered (i.e., they fall within the range of P10 to P90) then no bars are shown for that month.
A subset of stream gages also have enough data to generate estimates of observed functional flow metrics to compare with the predicted functional flows. Segments that have both observed monthly flows and observed functional flow metrics are shown in dark purple in the mapping tool. We only present these comparisons if there is enough daily stream flow data since 1980 to estimate the functional flow metric for 15 years or more for non-peak flow metrics, and 20 years or more for peak flow metrics or more. We then take the median observed metric over that time frame and compare to the 10th and 90th percentile model estimates for a functional flow metric. If the observed median is outside of this range, the flow is likely altered. If the observed median is inside this range, the flow is likely unaltered. In some cases, the median falls inside the range, but most of the observed years fall outside of the range, making the alteration status more difficult to determine. These cases are noted with an asterisk in the pop-up window, and are classified as “indeterminate". See Appendix J of the CEFF Guidance Document for more details on how to evaluate reference-based functional flow metrics against the same metrics calculated under current (observed or modeled) conditions to determine if functional flows are altered. Users interested in calculating flow alteration for a given stream gage location can use the companion Functional Flows Calculator .
Modeled Unimpaired and Existing flow data can be downloaded in zipped comma separated values (.csv) format on the “Data” page on this site.
Validation results indicated low accuracy for the mean daily modeled unimpaired and existing flow predictions compared to observed stream gage data across the state. However, in some regions and gages we found better model performance. For example, the daily modeled Unimpaired flows model performed best in snowmelt and perennial rain basins, most notably in northern California. COMIDs with drainage areas greater than 500 km2 showed consistently better performance than smaller basins for both the modeled Unimpaired and Existing flows data.
In the central and southern regions of the state that are characterized as intermittent and flashy rain, neither model performed well. Additionally, in systems with substantial flow alteration from human activities (e.g., dams and diversions), we found that the Existing flows model performed poorly. While there were some generalizations about how models performed regionally, there were still large inconsistencies in model performance for similar watersheds within a region. Both models tended to underestimate streamflow, as was seen by consistent negatively biased values. Inspection of the modeled data suggested that higher flow events were usually missed or were less than the observed magnitude. Additionally, baseflows were often difficult for the model to accurately predict. Although model accuracy was overall low for the Unimpaired and Existing predictions, these data provide a good first step in our understanding of modeled daily flow performance. Additionally, these data serve as a benchmark for comparison in specific watersheds where observed data is unavailable. Overall, our results reflect large uncertainty associated with reconstructing daily streamflow in ungaged or regulated systems. Ayers et al., 2025 provides a full statewide analysis of the accuracy of the predicted daily flow data (note: The "Existing" flows model is called "Actual" in this report).
In addition to the daily flow data, functional flow metrics derived from the modeled Existing flows data are available to download from the “Data” page and via the API. These data are calculated for all, wet, dry, and moderate year types for water year 2002 to 2022. Ayers et al., 2025 includes statewide maps of the modeled alteration of functional flow metrics in the “Supplemental Figures” section. Disclaimer: An accuracy assessment of the predicted alteration at 63 stream gage sites used for validation of the Existing flows model indicates that the correct alteration type is only predicted 54% of the time. Thus, any statewide patterns of modeled existing flow alteration derived from model predictions may be inaccurate and misleading.
A user can also download all data for predicted monthly and functional flow metrics (including monthly mean, minimum, and maximum daily flows for a month) by clicking the button with the plus sign in the bottom right corner of the popup window. The predicted monthly flow data is in a long data format, with each data value for each year and month in a unique row. The functional flow data is also in a long data format with metrics provided by year type (wet, dry, moderate, and all years). A user can also download data for all stream segments in a watershed by clicking the “Select by Watershed” tab. The watershed boundaries are based on the 10- or 12-digit hydrologic unit code (HUC10 or HUC12) level watersheds (Horizon Systems, 2018).
We published a paper illustrating statewide patterns of streamflow alteration based on the comparison between estimated and observed monthly flows. The analysis shows that the primary pattern of flow alteration across California is reduced flow variability. Most streams and rivers have flows that are both higher than expected (inflated) and lower than expected (depleted) depending on the time of year, due to moving water from wetter to drier seasons and from wetter to drier parts of the state. Flows are typically inflated during the dry summer months and depleted during the winter and spring, with losses of both the highest and lowest flows of the year (Zimmerman et al., 2017).
Ayers J., Stanford B., and Klausmeyer K. Modeling Actual Flows Evaluation . Technical Report prepared by The Nature Conservancy. San Francisco CA. 16 pages. October 2025.
California Environmental Flows Framework Technical Team. 2018. The California Environmental Flows Framework Guidance Document. Retrieved from http://ceff.ucdavis.edu
Dettinger, M. 2011. Climate change, atmospheric rivers and floods in California—A multimodel analysis of storm frequency and magnitude changes. Journal of the American Water Resources Association, 47, 514–523. https://doi.org/10.1111/j.1752-1688.2011.00546.x
Grantham TE, DM Carlisle, J Howard, B Lane, R Lusardi, A Obester, S Sandoval-Solis, B Stanford, ED Stein, KT Taniguchi-Quan, SM Yarnell, JKH Zimmerman. 2022. Modeling Functional Flows in California’s Rivers. Frontiers in Environmental Science. 10. https://www.frontiersin.org/article/10.3389/fenvs.2022.787473
Hanak, E., Lund, J., Dinar, A., Gray, B., Howitt, R., Mount, J., et al. 2011. Managing California's water: From conflict to reconciliation. San Francisco, CA: Public Policy Institute of California. Retrieved from http://books.google.com/books/about/Managing_California_s_Water.html?hl=&id=90hLp8aGrgIC .
Horizon Systems. 2015. National hydrography dataset plus: Horizon Systems Corporation. Retrieved June 1, 2015, from http://www.horizon-systems.com/nhdplus/ .
Read L., Elkurdy M., and Sampson A. K. Reach-based Daily Actual and Natural Flow Predictions . Technical Report prepared by Upstream Tech. 45 pages. February 2025.
Yarnell SM, Petts GE, Schmidt JC, Whipple AA, Beller EE, Dahm CN, Goodwin P, Viers JH. 2015. Functional Flows in Modified Riverscapes: Hydrographs, Habitats and Opportunities. BioScience. 65:10:963–972. https://doi.org/10.1093/biosci/biv102
Yarnell, SM, ED Stein, JA Webb, T Grantham, RA Lusardi, J Zimmerman, RA Peek, BA Lane, J Howard, S Sandoval-Solis. 2020. A functional flows approach to selecting ecologically relevant metrics for environmental flow applications. Freshwater Biology 36 318-324.
Zimmerman JKH, Carlisle DM, May JT, et al. 2017. Patterns and magnitude of flow alteration in California, USA. Freshwater Biology 2018;63:859–873. https://doi.org/10.1111/fwb.13058
California Environmental Flows Working Group (CEFWG). California Natural Flows Database: Functional flow metrics v1.2.1, May 2021. https://rivers.codefornature.org. (Date Accessed)
Julie K.H. Zimmerman, Daren M. Carlisle, Jason T. May, Kirk R. Klausmeyer, Theodore E. Grantham, Larry R. Brown, Jeanette K. Howard. California Unimpaired Flows Database v2.1.2, 2023. The Nature Conservancy. San Francisco CA. https://rivers.codefornature.org. (Date Accessed)
The Nature Conservancy and Upstream Tech. Predicted Daily Flow Data, Version 1.0.0, 2026. San Francisco, CA. https://rivers.codefornature.org. (Date Accessed)
The Nature Conservancy. Functional Flow Metrics from Predicted Daily Existing Flows, Version 1.0.0, 2026. San Francisco, CA. https://rivers.codefornature.org. (Date Accessed)
© Copyright The Nature Conservancy. Terms of Use | Privacy Policy
Select a watershed on the map to add all of the stream segments within it to the download queue.
Select a stream segment on the map and click the ‘+’ button to add stream to download queue.
In addition to the map-based viewer and download tool, the Natural Flows Database is also accessible through a simple but powerful RESTful Application Programming Interface (API). The API is publicly available for data analysis. It can be used with any programming language that supports HTTP requests such as Python, R, JavaScript, and many others as well as from a command line shell, e.g. using curl. In response to GET and POST requests, the API is able to stream CSV formatted data.
Click the following link to download a zip file of the entire functional flow metrics dataset: https://rivers.codefornature.org/data/ffm-final-v1.2.1.zip (103 MB)*
*Functional Flow metric predictions are generated from a statewide model (Grantham et al., 2022) or from observed values at regional reference gauges. Given the diversity of landscapes and stream conditions in California, the accuracy of metric estimates is expected to vary based on the physical setting of individual streams. Users should consider local circumstances when interpreting the data and refer to the California Environmental Flows Framework ceff.ucdavis.edu for additional guidance.
To advance daily streamflow predictions for streamflow management, The Nature Conservancy and Upstream Tech developed a set of models and datasets that utilized recent hydrological advancements in AI. In the approach, they used a type of neural network model called a Long Short-Term Memory (LSTM) model that is useful for time series data and learning relationships with input variables. Two models were developed, including the Unimpaired and Existing flows models. The Unimpaired model represents streamflow conditions in the absence of human alteration, while the Existing flows model reflects real world conditions, whether unimpaired or influenced by human activities, such as dam operations, water diversions and land use. The models shared the same structure but differed in their inputs and how they incorporated upstream observations.
Disclaimer: Our internal testing indicated that the models often poorly represented measured flow. Nash–Sutcliffe efficiency (NSE) values for each validation gage ranged from –16.83 to 0.84 (mean of –0.40) for the Unimpaired flows model and -238.61 to 0.96 (mean of –1.35) for the Existing flows model. Ideally, the mean NSE should be above 0.6 or 0.7, and a negative mean NSE indicates the model had poor performance. Please use the data with caution and read our accuracy report closely (note: The "Existing" flows model is called "Actual" in this report).
The predicted daily flow data are available from 10/1/2001 to 9/30/2022 for 155,438 stream segments in the NHD Plus hydrography dataset in California and some adjacent watersheds in Oregon, Nevada, and Arizona. The data are available for most streams that are part of the natural stream network (i.e., the stream order value is greater than zero). However, due to some errors in the modeling process, data for 4,607 comids were not modeled. These fall mostly on the coast and borders with adjacent states. This zipped table includes the comids with modeled data and this table includes the comids that are known to be missing from the daily flow model outputs. Before using the data, please review the metadata and terms of use. This table includes the links for zipped tables in comma separated values (CSV) format for both the daily modeled Unimpaired and Existing flows data.
In addition to generating predictions of daily flows, we calculated the functional flows from the Existing Flows model for most stream segments in California using the Functional Flows Calculator.
Disclaimer: Our internal testing indicates that the functional flow metrics derived from the Existing flows model poorly represented the functional flow metrics derived from observed streamflow, with NSE values ranging from -0.34 to -2.17. Ideally, the NSE should be above 0.6 or 0.7, and a negative NSE indicates the model had poor performance. Please use the data with caution and read our accuracy report closely (note: The "Existing" flows model is called "Actual" in this report).
The functional flow metrics from the predicted mean daily Existing flows model are summarized from water year 2002 to 2022 for most stream segments in California. Before using the data, please review the metadata and terms of use. This table includes the links for zipped tables in comma separated values (CSV) format for the functional flow metrics derived from daily modeled Existing flows data.
Since authentication, throttling, and rate limits are not yet implemented but may become necessary the current version is marked as beta. While the API is very stable, we don't guarantee its availability. While the API is ready for data download and analysis, please let us know if you plan to build an application. The data schema for version 2 is final. We might add fields but the name and the position of existing endpoints and fields will not change before the next major release. Data values might change due to model improvements. Citation requirements apply for the use of the data.
Please contact falk.schuetzenmeister@tnc.org for further questions.
The API provides two endpoints. The first one
https://flow-api.codefornature.org/v2/stream/
serves modelled natural flow data for every stream segment
(identified by NHDv2 COMID) in the dataset.
The second one
https://flow-api.codefornature.org/v2/ffm/
provides seasonally aggregated functional flow characteristics for
the same segments. Please refer to the science section for more
details.
The API can be tested in a web browser, no specific authentication
or format headers are required for GET requests (for POST see below).
If no comids query parameter is provided, the API returns
CSV file (Content-type: text/csv) with column headers but
without data.
To download data, query for an actual comid, for example
https://flow-api.codefornature.org/v2/stream/?comids=15039097.
This request returns all variables and years for the stream segment
with the COMID 15039097. The term “COMID” refers to the
common identifier within the
National Hyrdrography Dataset (NHDPlusV2)
which is used as reference throughout the project (and in other
hydrological work).
Please note that the request parameter comids is a
plural word. The provided value will be interpreted as a list. E.g.
https://flow-api.codefornature.org/v2/stream/?comids=15039097,2803945
will return data for both COMIDs. If a given COMID does not exist in
the Natural Flows database, the request will not return data for that
particular stream segment (but for other requested COMIDs that do
exist). If none of the requested COMIDs exist the CSV file will
only contain the header line. You will not receive a HTTP
error if non-existent data is requested.
The requests above triggers a CSV download which will be identically formatted and named as if requested from the form in the map-based tool:
comid,statistic,variable,year,month,value
15039097,max,estimated,1950,1,291321.317781431
15039097,max,estimated,1950,2,288226.252365343
15039097,max,estimated,1950,3,142474.19934679
15039097,max,estimated,1950,4,86750.5785288129
15039097,max,estimated,1950,5,40582.2848221952
15039097,max,estimated,1950,6,18109.1250910531
...
Progress bars and download time estimates will not work because of the streaming nature of the API. The file will not be fully prepared on our server before the download actually starts. Instead, records will be sent as they become available which increases speed and minimizes memory used by our server.
The entire dataset could be downloaded with the query parameter
comids=0. Please refrain from sending
this request unless you have a use for the entire dataset of roughly 42
Gbyte and a CSV file that cannot be handled in Microsoft Excel.
The Natural Flows API is a read-only API therefore we are not overly
concerned about security. However, we are concerned about resource use.
In the future we might restrict the amount of data that can be
requested per time unit and user (throttling). For future authentication
and metering, please expect to add a token= parameter to your
requests. Once implemented, you will be able to obtain an access token from
this page and the documentation will be updated accordingly.
Please don't rely on this API to build web applications since we cannot guarantee availability, performance, or scalability. Please contact us if you want to build something awesome with this data. Feel free to prototype, the API is CORS enabled.
We would appreciate, if you could cache downloads of more than 5 Mbyte
(all data for about 10 segments) on your machine whenever possible and specify
your requests used in scripts as much as possible in order to keep the load on
the server and the transferred amount of data low. For R users to get easily
started with caching see
https://cran.r-project.org/web/packages/httpcache/vignettes/httpcache.html.
The use of this package instead of httr will speed up your data
analysis significantly.
This section describes the endpoints of the API in detail, which CSV columns are available, and what query parameters can be used to limit the amount of data returned.
Query strings containing query parameters begin with a ? at
the end of the URL. Query parameters have the form keyword=value.
Several parameters are separated by an &. The query string
must not contain any spaces. Please note that some query parameters are plural
words. In these cases, a lists separated by commas without spaces, e.g.
statistics=min,maxreturns all of the requested data. Another
way to provide lists is by repeating the keyword, such as
statistics=min&statistics=max.
In URLs special characters need to be escaped. Most browsers and high
level programming languages will do that automatically or provide utility
functions. However, an URL like
https://flow-api.codefornature.org/v2/stream/?comids=15039097,2803945&statistics=mean,max&begin_year=1980&months=1,3,5
would be sent like this over the Internet:
https://flow-api.codefornature.org/v2/stream/?comids%3D15039097%2C2803945%26statistics%3Dmean%2Cmax%26begin_year%3D1980%26months%3D1%2C3%2C5
Some environments may require that the programmer takes explicitly care of this
(see https://www.w3schools.com/tags/ref_urlencode.asp
for more information on URL encoding).
The response mimetype for both endpoints is text/csv,
Accept headers do not have any effect.
This end point returns modelled natural flow data for every month between 1950 and the present. The CSV header line for this endpoint is:
comid,statistic,variable,year,month,value
Fields:
comid (string): NHDPlusV2 common identifierstatistic (string): statistics, e.g. max, mean, median, minvariable (string): percentile of model runsyear (integer): model yearmonth (integer): model monthvalue (number): modelled valueThe /stream/ endpoint provides query parameters
identical to the form fields in the map-based tool to subset and
slice data. Following parameters can be used to subset the data.
comids (list of integers): Comids in California where Natural
Flows Data is available (default: None, special values: 0 will request all)statistics (list of strings): max, mean, median, min
(default: all)variables (list of strings): estimated, p10, p90, observed
(default: all)begin_year (integer): one value between 1950 .. 2023 (default: 1950)end_year (integer): one value between 1950 .. 2023 (default: 2023)months (list of integers): list of values between 1 .. 12 (default: all)This endpoint returns the functional flow metrics for unimpaired or natural conditions (Grantham et al., 2022). The estimates of natural functional flow metrics are from a statewide model or observed values from regional reference gauges. Given the diversity of landscapes and stream conditions in California, the accuracy of metric estimates is expected to vary based on the physical setting of individual streams. Users should consider local circumstances when interpreting the data and refer to the California Environmental Flows Framework (ceff.ucdavis.edu) for additional guidance. The CSV header line for this endpoint is:
comid,ffm,wyt,p10,p25,p50,p75,p90,unit,source,gage_id,observed_years,observed_year_start,observed_year_end,alteration
Fields:
comid (string): NHDPlusV2 common identifierffm (string): functional flows metrics code (see
Science
page for description)wyt (string): water year typep10, p25, p50, p75, p90: modeling values for 10, 25, 50, 75 and 90 percentile
of runs, use p50 for the most likely valueunit: measurement unit for p10, p25, p50, p75, and p90source: source of p10, p25, p50, p75, and p90gage_id: only populated if source=observed,
USGS gage id where observedobserved_years: only populated if source=observed, number of years of observationsobserved_year_start: only populated if source=observed, first water year of observationsobserved_year_end: only populated if source=observed, last water year of observationsalteration: only populated if source=observed, alteration compared to modelled valueQuery parameters:
comids (list of integers): Comids in California where Natural
Flows Data is available (default: None, special values: 0 will request all)ffms (list of strings): ds_dur_ws, ds_mag_50, ds_mag_90, ds_tim,
fa_dur, fa_mag, fa_tim, peak_10, peak_2, peak_5, peak_dur_10,
peak_dur_2, peak_dur_5, peak_fre_10, peak_fre_2, peak_fre_5, sp_dur,
sp_mag, sp_roc, sp_tim, wet_bfl_dur, wet_bfl_mag_10, wet_bfl_mag_50,
wet_tim (default: all)wyts (list of strings): dry, moderate, wet, all (default: 'dry,moderate,wet,all')sources (list of strings): model, inferred, observedNote: Not all ffms or sources are
available for every comid. A single functional flows metric can
have multiple records from several sources. The combination
comid, ffm, source, gage_id is unique.
If sources=observation there are a few cases with
multiple records due to multiple gages on the stream segment.
Example:
https://flow-api.codefornature.org/v2/ffm/?comids=15039097,2803945&ffms=ds_dur_ws,ds_mag_50&wyts=dry
Values for inferred and observed are only available for a few records. Query with
https://flow-api.codefornature.org/v2/ffm/?comids=0&sources=observed,inferred.
Please allow for some time to finish.
This endpoint returns the functional flow metrics derived from the daily modeled existing dataset described above. As mentioned above, please use the data with caution and read our accuracy report closely (note: The "Existing" flows model is called "Actual" in this report). The CSV header line for this endpoint is:
comid,ffm,wyt,p10,p25,p50,p75,p90,unit,source,modeled_years,modeled_year_start,modeled_year_end
Fields:
comid (string): NHDPlusV2 common identifierffm (string): functional flows metrics code (see
Science
page for description)wyt (string): water year typep10, p25, p50, p75, p90: modeling values for 10, 25, 50, 75 and 90 percentile
of runs, use p50 for the most likely valueunit: measurement unit for p10, p25, p50, p75, and p90source: source of p10, p25, p50, p75, and p90modeled_years: number of years with modeled data for the ffc calculationmodeled_year_start: first water year of modeled datamodeled_year_end: last water year of modeled dataQuery parameters:
comids (list of integers): Comids in California where
daily modeled existing data is available (default: None, special values: 0 will request all)ffms (list of strings): s_dur_ws, ds_mag_50, ds_mag_90, ds_tim,
fa_dur, fa_mag, fa_tim, peak_10, peak_2, peak_5, peak_dur_10,
peak_dur_2, peak_dur_5, peak_fre_10, peak_fre_2, peak_fre_5, sp_dur,
sp_mag, sp_roc, sp_tim, wet_bfl_dur, wet_bfl_mag_10, wet_bfl_mag_50,
wet_tim (default: all)wyts (list of strings): dry, moderate, wet, all (default: 'dry,moderate,wet,all')Note: Not all ffms are available for every comid. The combination comid, ffm, source is unique.
RESTful APIs make use of the different verbs provided by the HTTP protocol for specific purposes. GET requests are typically used for requesting data without making changes to the data.
In a GET request all specifics that are needed to query data are provided in the URL as query parameters. This approach is only limited by the maximum length URLs can have. For the Natural Flows API the limit is 4,096 characters but some browsers will limit URLs to 2,048 characters (including protocol and domain name). Since the Natural Flows dataset contains roughly 130,000 stream segments this limit could matter, e.g. if you want to request the data for all stream segments in Southern California. The API provides the ability to POST a long list of COMIDS.
Currently two content types for the request body of POST requests
are supported application/x-www-form-urlencoded
(default) and application/json. The response will be
a CSV file (Content-Type: text/csv), the same format
as the map interface or GET requests.
The content type (application/x-www-form-urlencoded)
is typically generated through HTML forms like:
<form action="https://flow-api.codefornature.org/v2/stream/" method="post">
  <!-- Use type=hidden for values preselected by app interactions -->
  <input type="hidden" name="comids" value="15039097,2803945">
  <!-- Use same name (not id!) for multiple choice -->
  <span>Statistics:</span>
  <label for="min">Min</label>
  <input id="min" type="checkbox" name="statistics" value="min">
  <label for="mean">Mean</label>
  <input id="mean" type="checkbox" name="statistics" value="mean" checked="true">
  <label for="median">Median</label>
  <input id="median" type="checkbox" name="statistics" value="median">
  <label for="max">Max</label>
  <input id="max" type="checkbox" name="statistics" value="max">
  <!-- add additional fields here -->
  <button type="submit">Download</button>
</form>
While application/x-www-form-urlencoded queries can be
generated by most scripting languages, the use of JSON
seems more convenient. In both cases, the same keywords
(and allowed values) as for GET requests apply
(e.g. for /streams/: comids, statistics, variables, begin_year, end_year, months).
If you post a JSON body the
Content-Type header has to be explicitly set to
application/json:
POST request cannot easily be evaluated in the browser. There
are tools like Postman
or the Firefox plugin
Rested
that do allow for convenient evaluation of POST requests.
Using the command line tool curl a POST request could
look like this:
curl \
-H "Content-Type: application/json" \
-d '{"comids":[15039097,2803945],"statistics":["min","max"],"variables":["estimated"],"begin_year":1980,"end_year":1981,"months":[1,2]}' \
-X POST https://flow-api.codefornature.org/v2/stream/In the section above, we described how to submit long lists of COMIDSs to the API. This raises the question how these lists can be generated, e.g. from a geographic region, a river basin, or a feature name. The Natural Flows API does currently not provide a build-in way to query for COMIDs. We avoided to duplicate resources that already exist in one form or another. We will add capabilities to generate COMID lists by interacting with the map-based tool in the future.
The canonical reference for the work with stream segments and COMIDs
is the NHDPlusV2 dataset. This dataset can be downloaded from
Environmental Protection Agency website. For the current extent of the
API, you will find the stream lines in:
https://dmap-data-commons-ow.s3.amazonaws.com/NHDPlusV21/Data/NHDPlusCA/NHDPlusV21_CA_18_NHDSnapshot_05.7z.
Use GIS or other geoprocessing tools to extract COMIDs of
interest.
Error handling is not yet fully implemented and malformed query
parameters (e.g. wrong data types or invalid special characters)
might occasionally result in an Internal Server Error
(500) when it should actually return a Bad Request
(400) instead. Syntactically correct queries resulting in an empty
set of data will return a CSV file containing just the header line
(no error message). Invalid query parameter keywords and values
will be ignored.
In some context you might get a Moved Permanently (301) status
message for queries that worked perfectly fine in a browser. The
reason is that requests using the HTTP protocol will be redirected
to the secure HTTPS protocol. Another reason could be that you
forgot the trailing slash in the URL since /v2/stream
will be redirected to /v2/stream/. While your browser
will just follow these redirects the http function in your scripting
language might not. Curl will follow redirects only if provided with
the -L flag. Make sure to request with the correct protocol
(https://) and the trailing slash at the end of the URL.
Accept headers are currently ignored.
Content-Type: text/csv will be served no matter what.
The API does not issue Not Acceptable (406)
errors or any other data format than CSV. Make sure that your code
can handle the response.
Please use the code examples to get started in different programming languages. Please consider storing large API returns to your hard disk in order to use resources carefully.
"""
Example using the Natural Flows API
"""
import urllib.request
from urllib.parse import urlencode

URL = 'https://flow-api.codefornature.org/v2/stream/'

def main():
  query = {
      'comids': [15039097, 2803945],
      'statistics': ['min', 'max'],
      'variables': 'estimated',
      'begin_year': 2014,
      'months': [1]
  }
  url = '?'.join([URL, urlencode(query, True)])
  print('Requested URL', url)
  csv_file = urllib.request.urlopen(url)
  for line in csv_file:
      print(line.decode('utf8'), end='')

if __name__ == '__main__':
main()Here is a very simple R example which is not yet equivalent to the Python example:
library(httr)

url <- "https://flow-api.codefornature.org/v2/stream/?comids=15039097"
r <- GET(url)
# The content function of the httr library uses the Content-Type header
# to determine how to parse the data, text/csv in our case
content(r)
Grantham TE, DM Carlisle, J Howard, B Lane, R Lusardi, A Obester, S Sandoval-Solis, B Stanford, ED Stein, KT Taniguchi-Quan, SM Yarnell, JKH Zimmerman. 2022. Modeling Functional Flows in California’s Rivers. Frontiers in Environmental Science. 10. https://www.frontiersin.org/article/10.3389/fenvs.2022.787473
California Environmental Flows Working Group (CEFWG). California Natural Flows Database: Functional flow metrics v1.2.1, May 2021. https://rivers.codefornature.org. (Date Accessed)
Julie K.H. Zimmerman, Daren M. Carlisle, Jason T. May, Kirk R. Klausmeyer, Theodore E. Grantham, Larry R. Brown, Jeanette K. Howard. California Unimpaired Flows Database v2.1.2, 2023. The Nature Conservancy. San Francisco CA. https://rivers.codefornature.org. (Date Accessed)
The Nature Conservancy and Upstream Tech. Predicted Daily Flow Data, Version 1.0.0, 2026. San Francisco, CA. https://rivers.codefornature.org. (Date Accessed)
The Nature Conservancy. Functional Flow Metrics from Predicted Daily Existing Flows, Version 1.0.0, 2026. San Francisco, CA. https://rivers.codefornature.org. (Date Accessed)
© Copyright The Nature Conservancy. Terms of Use | Privacy Policy
Explore auxiliary applications, dashboards, and visualizations that draw from the Natural Flows Database
California Environmental Flows Working Group (CEFWG). California Natural Flows Database: Functional flow metrics v1.2.1, May 2021. https://rivers.codefornature.org. (Date Accessed)
Julie K.H. Zimmerman, Daren M. Carlisle, Jason T. May, Kirk R. Klausmeyer, Theodore E. Grantham, Larry R. Brown, Jeanette K. Howard. California Unimpaired Flows Database v2.1.2, 2023. The Nature Conservancy. San Francisco CA. https://rivers.codefornature.org. (Date Accessed)
The Nature Conservancy and Upstream Tech. Predicted Daily Flow Data, Version 1.0.0, 2026. San Francisco, CA. https://rivers.codefornature.org. (Date Accessed)
The Nature Conservancy. Functional Flow Metrics from Predicted Daily Existing Flows, Version 1.0.0, 2026. San Francisco, CA. https://rivers.codefornature.org. (Date Accessed)
© Copyright The Nature Conservancy. Terms of Use | Privacy Policy
You can use the map or search feature to find any stream or river in California. To use the map, open the map page, then zoom in using the plus buttons in the upper left of the screen, the mouse wheel, or pinch gesture on mobile and touch screens. As you zoom in, more streams and rivers will appear on the map. Click on your river of interest to see the natural flow estimates for that location.
To use the search feature, click on the magnifying glass in the upper right of the map screen. Type in a river name, a stream gage name, a place name, the COMID for a stream segment from the NHDPlus (v2) dataset, or even the latitude and longitude coordinates. As you type, a list of search results will appear below the search box, organized into groups including stream segments, stream gages, and places from the Esri geocoding service. Click on a search result and the map will automatically zoom to that location.
Natural flows (both monthly and functional flow estimates) were estimated based on watershed characteristics, rainfall, and temperature data. The relationship between these predictor variables and the flow estimates were developed using machine learning models developed from reference stream gages. Reference stream gages have relatively natural watersheds with little flow impairment from dams or diversions for at least a portion of time when the gage was recording data. The reference gages are symbolized with blue circles on the map, and clicking on them will indicate the time period when the gage had relatively unimpaired flows. Note that some of the reference gages were not used in the functional flow models. Also, many reference gages may not be considered reference for the entire period of record. For more information, see the science page.
Functional flow metrics were predicted for all streams across all years and by three water year types (dry, moderate, and wet), with the exception of the peak flow metrics. Peak flows (2-year, 5-year, and 10-year floods) were predicted across all years, because they are based on flow recurrence intervals (see science page for more information on these metrics). Peak flow duration and frequency metrics may be missing for some smaller stream segments because they inferred from reference gages and there was insufficient information to relate some smaller stream segments to reference gages. Observed functional flow metrics are currently only available on a subset of stream segments with USGS stream gages. Missing data for one or more metrics or water year types indicates insufficient observed data for calculation.
Yarnell SM, Petts GE, Schmidt JC, Whipple AA, Beller EE, Dahm CN, Goodwin P, Viers JH. 2015. Functional Flows in Modified Riverscapes: Hydrographs, Habitats and Opportunities. BioScience. 65:10:963–972. https://doi.org/10.1093/biosci/biv102
California Environmental Flows Working Group (CEFWG). California Natural Flows Database: Functional flow metrics v1.2.1, May 2021. https://rivers.codefornature.org. (Date Accessed)
Julie K.H. Zimmerman, Daren M. Carlisle, Jason T. May, Kirk R. Klausmeyer, Theodore E. Grantham, Larry R. Brown, Jeanette K. Howard. California Unimpaired Flows Database v2.1.2, 2023. The Nature Conservancy. San Francisco CA. https://rivers.codefornature.org. (Date Accessed)
The Nature Conservancy and Upstream Tech. Predicted Daily Flow Data, Version 1.0.0, 2026. San Francisco, CA. https://rivers.codefornature.org. (Date Accessed)
The Nature Conservancy. Functional Flow Metrics from Predicted Daily Existing Flows, Version 1.0.0, 2026. San Francisco, CA. https://rivers.codefornature.org. (Date Accessed)
© Copyright The Nature Conservancy. Terms of Use | Privacy Policy
The California Natural Flows Database is made available under the Open Database License. Find the terms and conditions at opendatacommons.org.
The database and all its data are "as is" and "as available"
without warranty of any kind either express or implied, including
but not limited to the implied warranties of merchantability,
fitness for a particular purpose, freedom from contamination by
computer viruses and malware, and non-infringement. The Nature
Conservancy makes no warranty as to the accuracy, completeness or
reliability of any data available through the database and the
website. You are responsible for verifying any information before
relying on it. use of the website, database, and the data is at
your sole risk. If you have obtained data from a source other
than https://rivers.codefornature.org, be aware that
electronic data can be altered subsequent to original
distribution. Data can also quickly become out-of-date.
To the maximum extent permitted by law, The Nature Conservancy disclaims all liability, whether based in contract, tort (including negligence), strict liability or otherwise, and further disclaims all losses, including without limitation indirect, incidental, consequential, or special damages arising out of or in any way connected with access to or use of the website, database, or the data even if The Nature Conservancy has been advised of the possibility of such damages.
California Environmental Flows Working Group (CEFWG). California Natural Flows Database: Functional flow metrics v1.2.1, May 2021. https://rivers.codefornature.org. (Date Accessed)
Julie K.H. Zimmerman, Daren M. Carlisle, Jason T. May, Kirk R. Klausmeyer, Theodore E. Grantham, Larry R. Brown, Jeanette K. Howard. California Unimpaired Flows Database v2.1.2, 2023. The Nature Conservancy. San Francisco CA. https://rivers.codefornature.org. (Date Accessed)
The Nature Conservancy and Upstream Tech. Predicted Daily Flow Data, Version 1.0.0, 2026. San Francisco, CA. https://rivers.codefornature.org. (Date Accessed)
The Nature Conservancy. Functional Flow Metrics from Predicted Daily Existing Flows, Version 1.0.0, 2026. San Francisco, CA. https://rivers.codefornature.org. (Date Accessed)
© Copyright The Nature Conservancy. Terms of Use | Privacy Policy